Getting the Graph to Start at Later Measurements
|
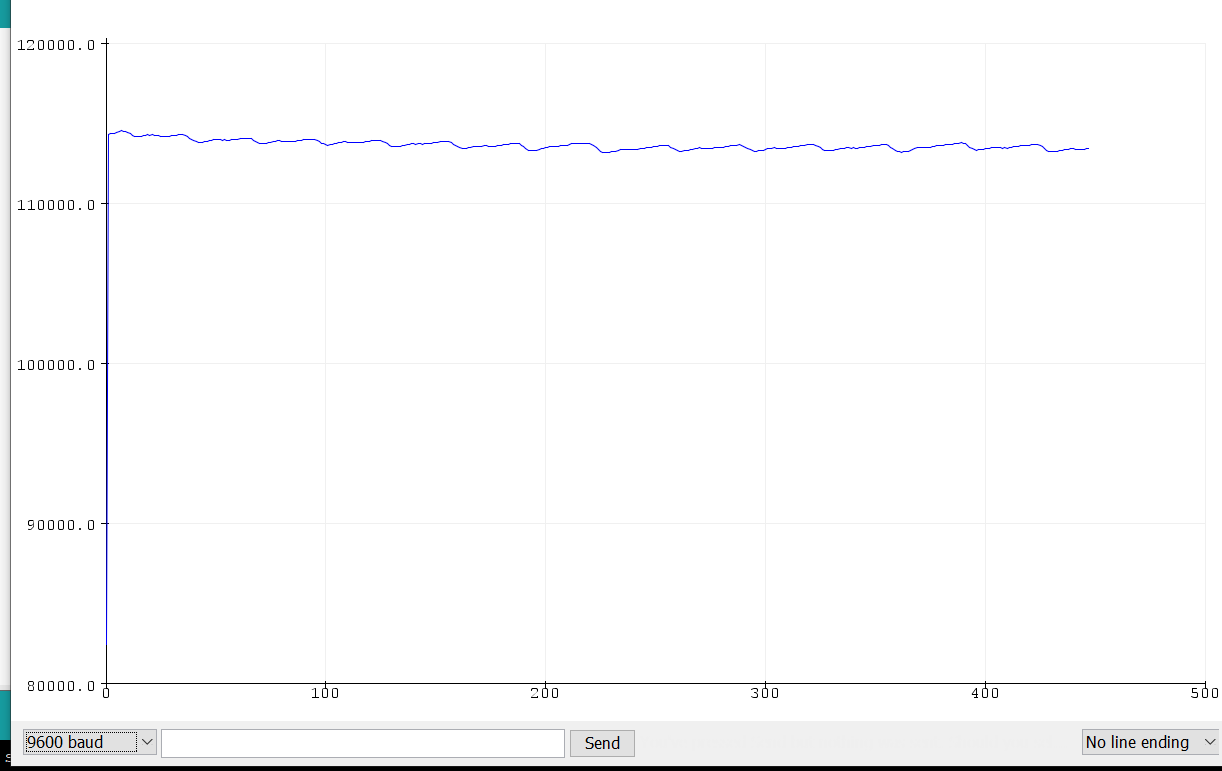
Does your graph start off this? The first values start at zero, and then it goes to the normal values? It seems to take a few cycles to get going before it prints off real data values. We want to make it not do that and just start at the real data. To do this, we need to prepopulate the graph with 500 data points so it starts scrolling when we start the data collection.
|
|
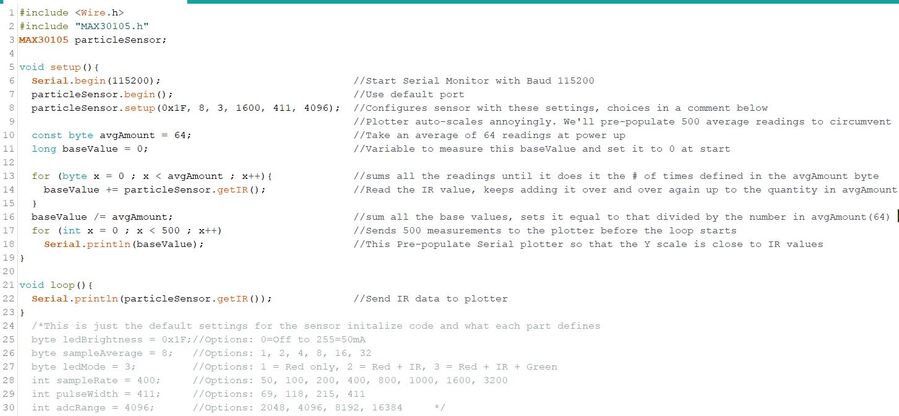
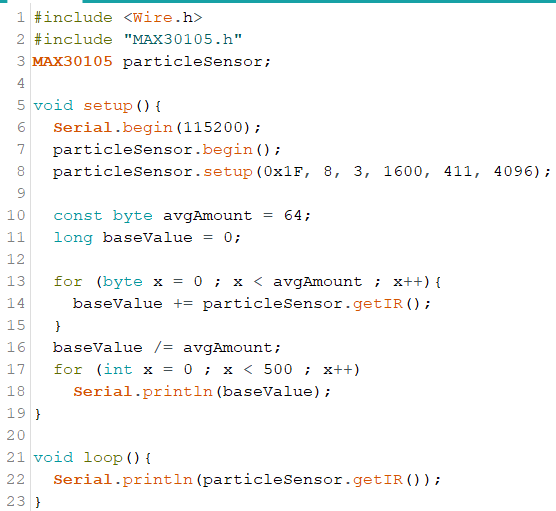
The fix, prepopulate the plotter with 500 values on startup!
|
If we take 500 initial average measurements on sensor startup, then those first few zero data points get averaged out and also the plotter starts at data point 501 in the loop so the scrolling and zoom in features are happening right when the loop starts.
Mr. Dorsey explaining the sensor and code.
|
|
Here are comments explaining what the code does